How to Troubleshoot Java CPU usage Issues (In English)
How to Troubleshoot Java CPU usage with Easy language
If you have deployed a Java application in production, you’ve probably encountered a situation where the application suddenly starts to take up a large amount of CPU. When this happens, application response becomes sluggish and users begin to complain about slow response. Often the solution to this problem is to restart the application and, lo and behold, the problem goes away – only to reappear a few days later. A key question then is: how to troubleshoot high CPU usage of a Java application?
Why Do Java Applications Take High CPU?
Java applications may take high CPU resources for many reasons:
- Poorly designed application code with inefficient loops: Recursive method calls, inefficient usage of collections (e.g., excessively large ArrayLists instead of say using HashMaps) can also be reasons for this.
- Shortage of memory in the Java Virtual Machine (JVM). can also reflect in high CPU usage. Instead of spending time in processing, the JVM spends more time in Garbage Collection, which in turn takes up CPU cycles.
- A JVM may max out on CPU usage because of the incoming workload. The server capacity may not be sized sufficiently to handle the rate of requests coming in and in such a situation, the Java application may be doing work, trying to keep up with the workload.
Restarting an application will not solve a CPU usage problem – it only mitigates the problem for a short while, until the problem reappears. It is, therefore, essential to identify the cause of the CPU spike: is it due to poorly designed application code, insufficient memory allocation, or an unexpectedly high workload?
JVM Monitoring Can Assist with Diagnosis of CPU Issues
Modern JVMs (1.5 and higher) support Java Management Instrumentation (JMX) APIs. According to Wikipedia, Java Management Extensions is a Java technology that supplies tools for managing and monitoring applications, system objects, devices and service-oriented networks. Those resources are represented by objects called MBeans (for Managed Bean). Managing and monitoring applications can be designed and developed using the Java Dynamic Management Kit.
Using JMX, Java monitoring tools can explore what threads are running in the JVM, the state of each thread, the CPU usage of each thread etc. By periodically collecting these statistics, monitoring tools can correlate thread level performance information with the CPU usage of the Java application and answer the question “Why is the Java application taking high CPU?”.
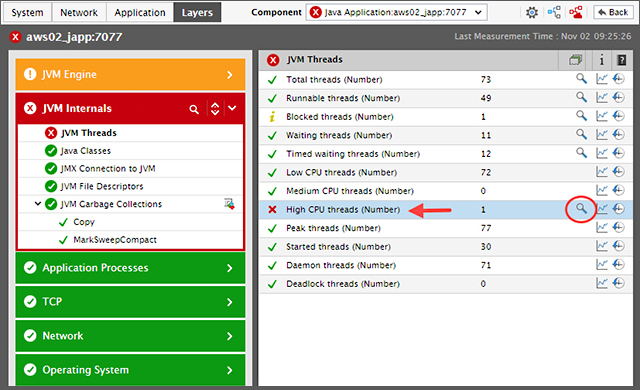
Figure 1 below depicts the monitoring of threads in a JVM. High and medium CPU threads are defined as threads that take up more than 50% CPU and 30-50% CPU respectively. The existence of any high or medium CPU thread is indicative of an application bottleneck, i.e., a piece of inefficient code that is executing frequently and taking up CPU. In this example, there is one high CPU thread.
Here is some Images which Can help to you ...
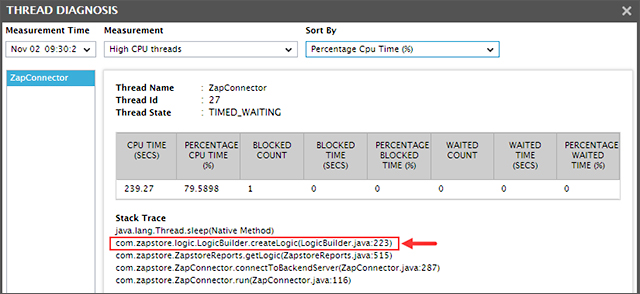
Detailed diagnosis of this metric reveals the stack trace – i.e., which line of code is the thread that is taking CPU executing. If the thread is assigned a name in the application, the thread name is shown on the left-hand side of Figure 2 and the detailed stack trace is on the right-hand side. This information gives operations staff and developers exactly what they need to identify the cause of high CPU usage. The exact class, method and line of code can be determined. In this example, look in the com.zapstore.logic. Logic Builder class, create Logic method and line number 223.
In given below image it is given that the causes of high JVM CPU usage:-
If the CPU usage is due to an unexpected workload increase, you should see the number of threads increase, and even if each thread consumes a small amount of CPU, the aggregate may be significant.
If none of the application threads is taking much CPU, the aggregate CPU usage of the application threads is low and yet the Java application is taking CPU, suspect garbage collection activity in the JVM. You may want to change the garbage collection algorithm or increase the heap and non-heap memory available to the JVM to alleviate the problem.
Historical information captured about the JVM’s CPU usage and individual threads’ CPU usage can be used to determine what is the real cause of the Java application’s high CPU usage. You will no longer need to restart the application and hope that the problem goes away. The historical insights (like shown below in Figure 3) will help you accurately determine the cause of CPU spikes and fix them, so you do not have to deal with the same issues ever again.

For more question Please Comment Down:-
And Share this blogs to everyone
Thank You

Comments
Post a Comment